
When investors ask, “Is a stock overvalued?”, they’re often looking for a quick, reliable metric to assess value. One of the most widely used tools in this evaluation is the price-to-earnings ratio (P/E ratio). This simple yet powerful indicator compares a company’s current share price to its earnings per share (EPS), offering insight into how much investors are willing to pay for each dollar of profit. A high P/E ratio may suggest overvaluation—but it doesn’t always mean the stock is a bad buy.
The P/E ratio helps investors gauge whether a stock is priced fairly relative to its earnings. However, interpreting it correctly requires more than just comparing numbers. Market expectations, industry norms, growth potential, and economic conditions all influence what constitutes a “reasonable” P/E. In this article, we’ll break down how the P/E ratio works, how to interpret it, and when it might mislead you.
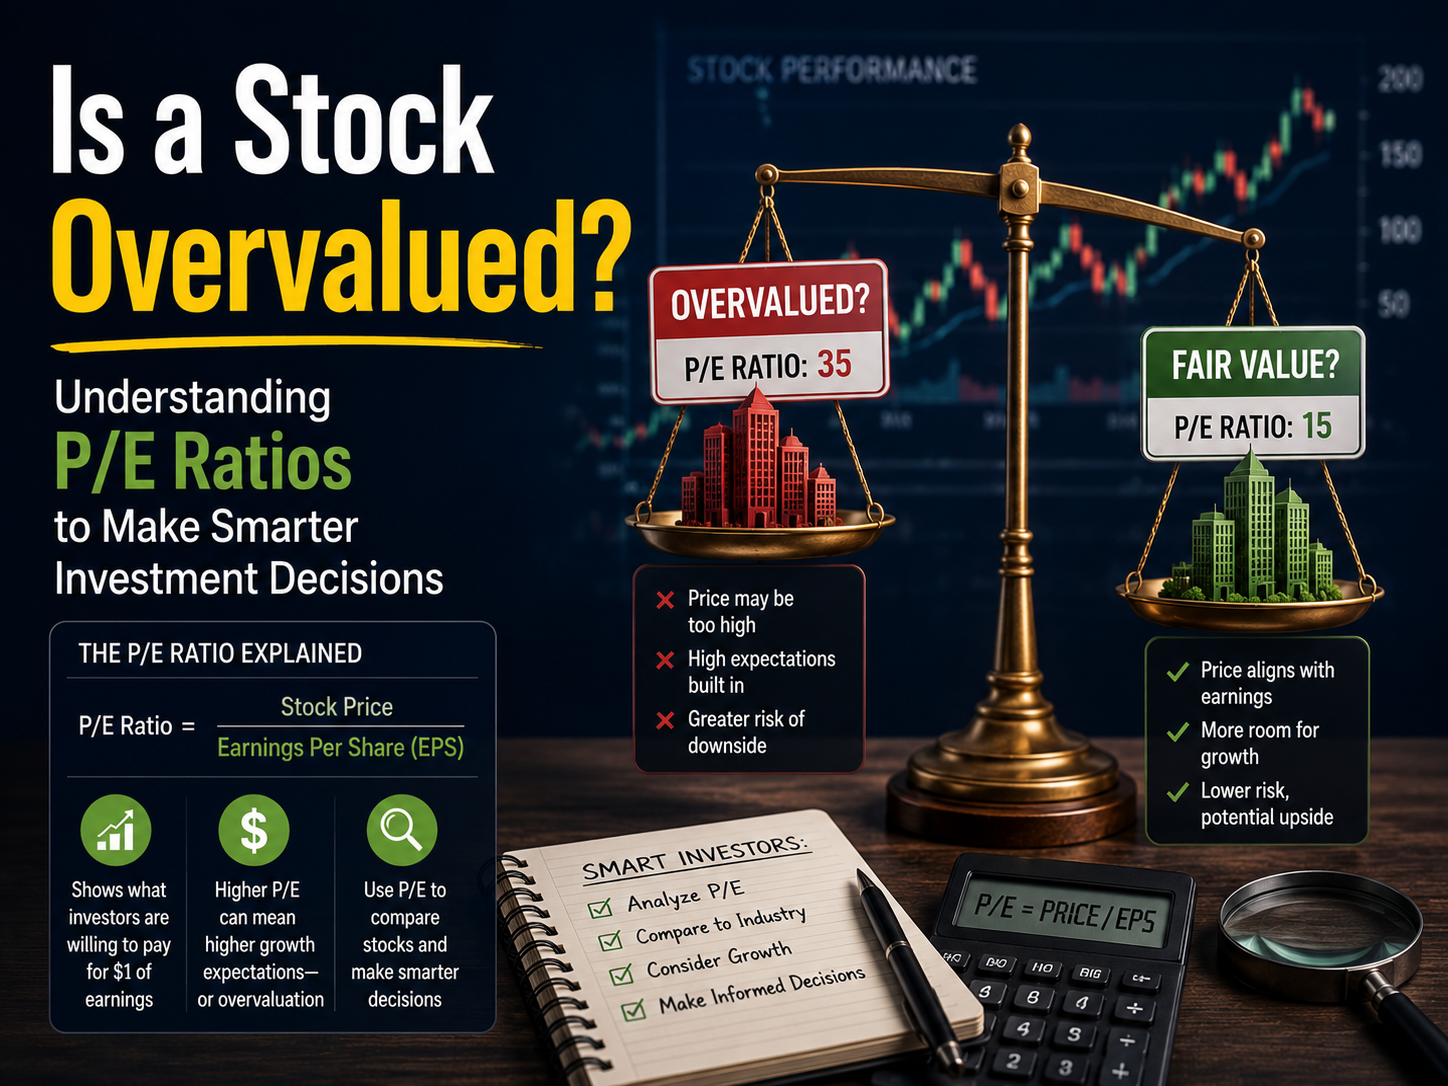
What Is the P/E Ratio and How Is It Calculated?
The P/E ratio is calculated by dividing a company’s current market price per share by its earnings per share (EPS). The formula is straightforward:
- P/E Ratio = Market Price per Share / Earnings per Share (EPS)
For example, if a company’s stock trades at $50 and its EPS over the past 12 months is $5, the P/E ratio is 10. This means investors are paying $10 for every $1 of earnings. While this seems simple, the real challenge lies in understanding what that number truly signifies.
There are two main types of P/E ratios: trailing P/E and forward P/E. The trailing P/E uses actual earnings from the past 12 months, making it a backward-looking measure. The forward P/E, on the other hand, uses projected future earnings, which can be more speculative but useful for growth-oriented companies.
High P/E vs. Low P/E: What Do They Really Mean?
A high P/E ratio often raises red flags. It may indicate that investors expect strong future growth, or it could signal that the stock is overvalued. For instance, tech startups or high-growth firms often have elevated P/E ratios because investors anticipate rapid earnings expansion.
Conversely, a low P/E ratio might suggest the stock is undervalued or that the company faces challenges. However, a low P/E doesn’t automatically mean a bargain. It could reflect declining earnings, poor management, or industry headwinds.
Context is everything. Comparing a stock’s P/E to its historical average, industry peers, and the broader market provides a clearer picture. A P/E of 30 might be normal for a fast-growing software company but excessive for a mature utility firm.
Limitations of the P/E Ratio: When It Can Mislead
While the P/E ratio is a useful starting point, it has notable limitations. One major issue is that it relies on earnings, which can be manipulated or distorted by one-time events, accounting practices, or economic cycles.
For example, a company with temporarily depressed earnings due to a restructuring may show an artificially high P/E, even if its long-term prospects are strong. Similarly, firms with negative earnings (losses) have no meaningful P/E ratio, rendering the metric useless.
Additionally, the P/E ratio doesn’t account for debt, cash flow, or growth rates. A company with high debt might appear cheap based on P/E alone, but its financial risk could make it a poor investment. Always combine P/E analysis with other financial metrics like debt-to-equity ratio, free cash flow, and return on equity (ROE).
How to Use P/E Ratios in Real Investment Decisions
To effectively use the P/E ratio, investors should adopt a comparative approach. Start by analyzing the stock’s P/E relative to:
- Its own historical P/E range – Has the ratio been consistently higher or lower?
- Industry peers – How does it stack up against competitors?
- Market averages – Compare to the S&P 500 or relevant index.
For growth stocks, consider the PEG ratio (P/E divided by earnings growth rate), which adjusts for expected growth. A PEG ratio below 1 may indicate undervaluation relative to growth potential.
Also, pay attention to market sentiment. During bull markets, P/E ratios across the board tend to rise as optimism drives valuations higher. In downturns, even solid companies may trade at low P/Es due to fear, creating potential buying opportunities.
Key Takeaways: Making Sense of P/E Ratios
- The P/E ratio compares a stock’s price to its earnings and helps assess valuation.
- A high P/E doesn’t always mean overvalued—growth expectations matter.
- A low P/E isn’t automatically a bargain—investigate the underlying reasons.
- Use trailing and forward P/Es depending on your investment horizon.
- Always compare P/E ratios within industry and historical contexts.
- Combine P/E analysis with other financial indicators for a complete picture.
FAQ: Common Questions About P/E Ratios and Stock Valuation
What is a “good” P/E ratio?
There’s no universal “good” P/E ratio. It depends on the industry, growth stage, and economic environment. Historically, the S&P 500 has averaged a P/E of around 15–20. However, high-growth sectors like technology often trade at much higher multiples.
Can a stock with a high P/E still be a good investment?
Yes. If a company is expected to grow earnings rapidly, a high P/E may be justified. Investors are paying for future potential, not just current profits. Always assess growth prospects and competitive advantages.
Why do some profitable companies have no P/E ratio?
If a company reports negative earnings (a loss), the P/E ratio becomes negative or undefined. In such cases, investors rely on alternative metrics like price-to-sales (P/S) or enterprise value-to-EBITDA.